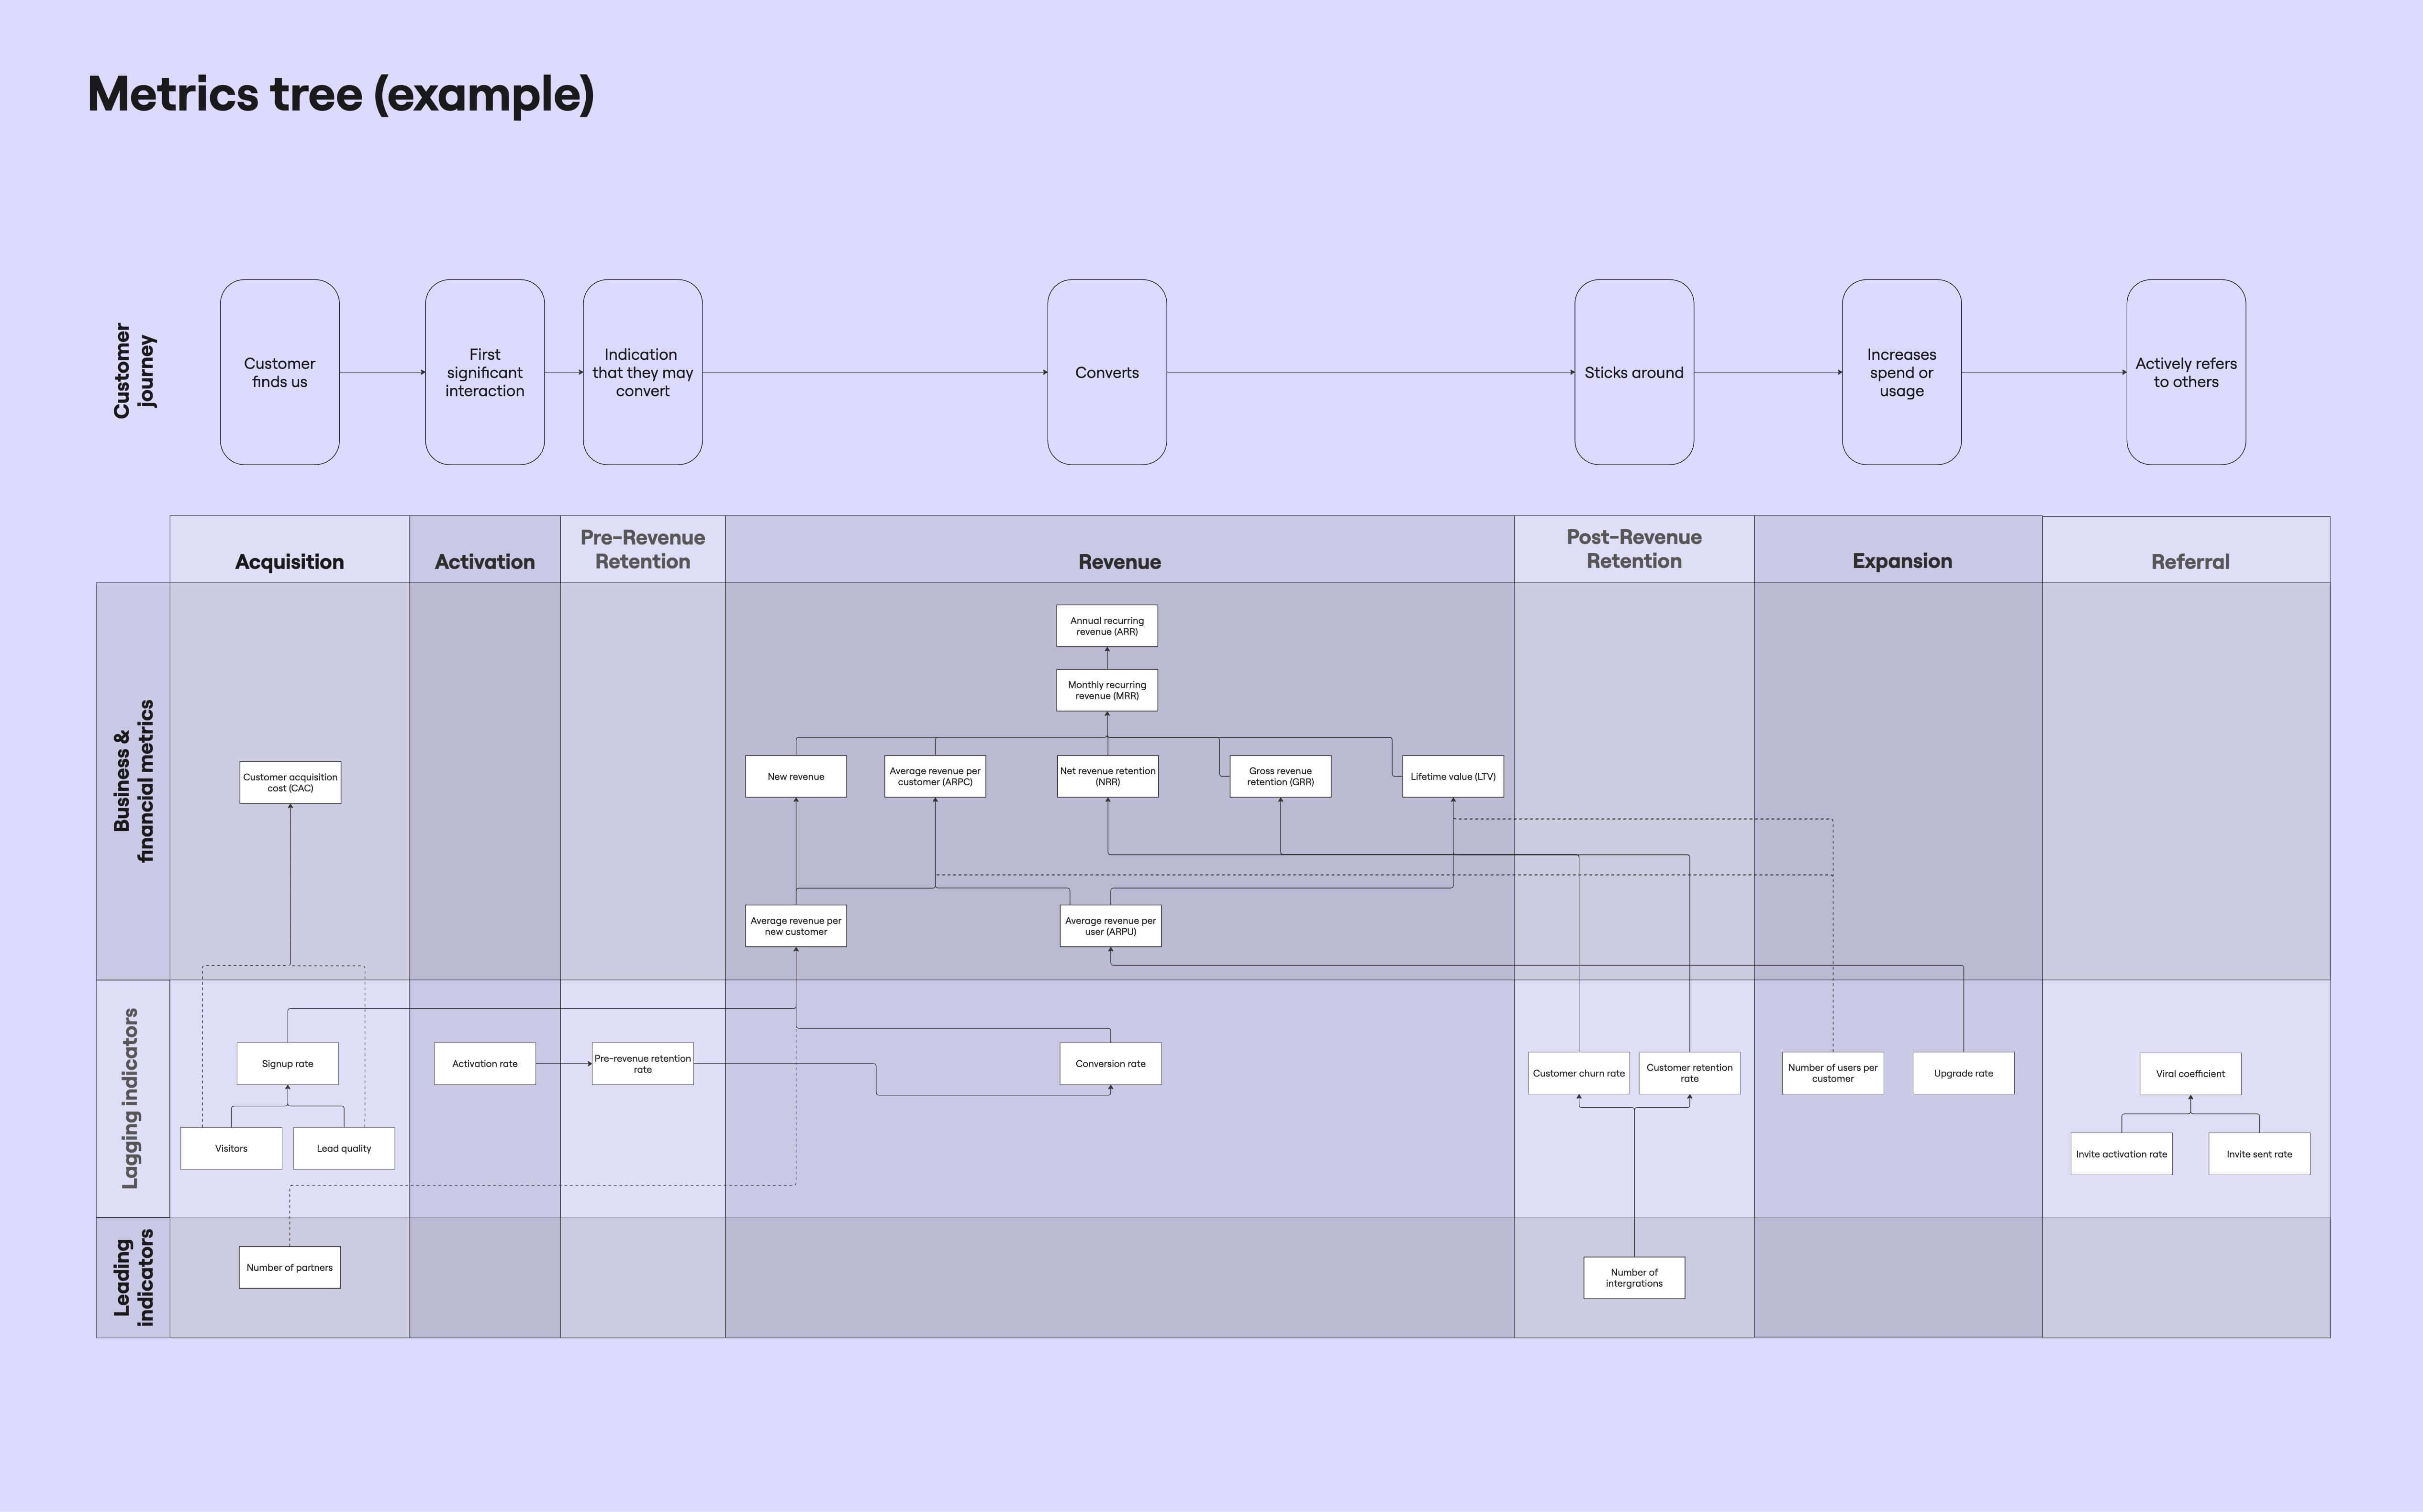
Template: Metrics Tree
We’re big believers in creating strong links between what your teams are building and what the business actually needs. We wrote about this in detail at "Aligning product metrics with business goals: A step-by-step approach," and now we've created a metrics tree Miro template — a practical tool to help product teams connect the dots between day-to-day product activity and high-level company goals.
What is it?
A metrics tree is a simple, structured way to map how your product drives business outcomes. It helps you visualise how user behaviours and product metrics ladder up to strategic goals — and where the gaps might be.
Rather than starting with “what should we track?”, it starts with what matters to the business — and works backwards from there.
This exercise can help you:
- Align product work with business priorities
- Spot measurement gaps and vague metrics
- Create a shared understanding across teams
- Prioritise what to track and improve
- Communicate product impact more clearly
It’s particularly useful when planning OKRs, kicking off a new initiative, or trying to focus measurement efforts.

How to get the most out of it
The key to a useful metrics tree is to approach it from both ends: top-down (starting with business goals) and bottom-up (starting with user behaviour). This gives you a full picture of how product work contributes to strategic success — and where that link is fuzzy or missing.
Here’s how to run a metrics tree session, step by step:
1. Define the business outcomes
Start by identifying the key strategic goals or KPIs that matter most to leadership. These sit at the top of the tree. Pull them from OKRs, board reports, or strategy docs. Be specific — think “increase monthly active users by 25%” rather than just “grow the business”.
2. Map key user journeys
Choose one or two critical user flows — onboarding, activation, purchase, etc. Break them down step by step. For each step, ask:
- What does success look like here?
- What behaviours should we track?
- What are we tracking today?
This gives you the building blocks at the bottom of the tree.
3. Connect product metrics to business goals
Now bridge the middle: how do product-level metrics support business outcomes? For each behaviour or event, ask:
- If this metric moved, would it influence one of our goals?
- How direct is the link?
- What assumptions are we making?
You’re looking to create a clear, logical chain from user behaviour to product success to business impact.
4. Spot the gaps and prioritise
Once your draft tree is up, step back and review:
- Are there missing links?
- Are there metrics we don’t trust?
- Are some goals unsupported by any product activity?
Highlight what’s strong, what needs work, and what needs defining. Use colours or tags to make this visible.
5. Turn insight into action
The output isn’t just a pretty diagram — it’s a living artefact. Assign owners to key metrics. Clarify next steps for instrumentation. Use it to inform OKRs, dashboards, or team goals.
Give our metrics tree template a go and see how it helps your team clarify what matters, what’s measurable, and what’s missing. Or check out one of our other templates:
- Service blueprint – to help you visualise existing products, create shared understanding, identify improvements, and describe a future vision.
- Decision stack – a distilled view of your vision and strategy, setting the direction of travel for the short, mid, and long-term.
- Product team canvas – a one-pager where anyone can quickly get a sense of the shape of a product team's domain, people, tech, and context.
Or check out our Capsule case study, where we put our metrics tree template through its paces, and helped:
- Define and align on key product metrics and their link to commercial KPIs
- Map the full data landscape and highlight opportunities to improve access and consistency
- Create an impact definition and monitoring framework, including templates and user guides
- Have conversations around the metrics tree, honing in on what matters
- Recommend actionable next steps, including correlation analysis, strategy alignment, and financial modelling

