Aligning product metrics with business goals: A step-by-step approach
Many tech companies struggle to connect what they’re building with the outcomes the business needs. It’s not for lack of effort - defining the right metrics and aligning on success is genuinely hard.
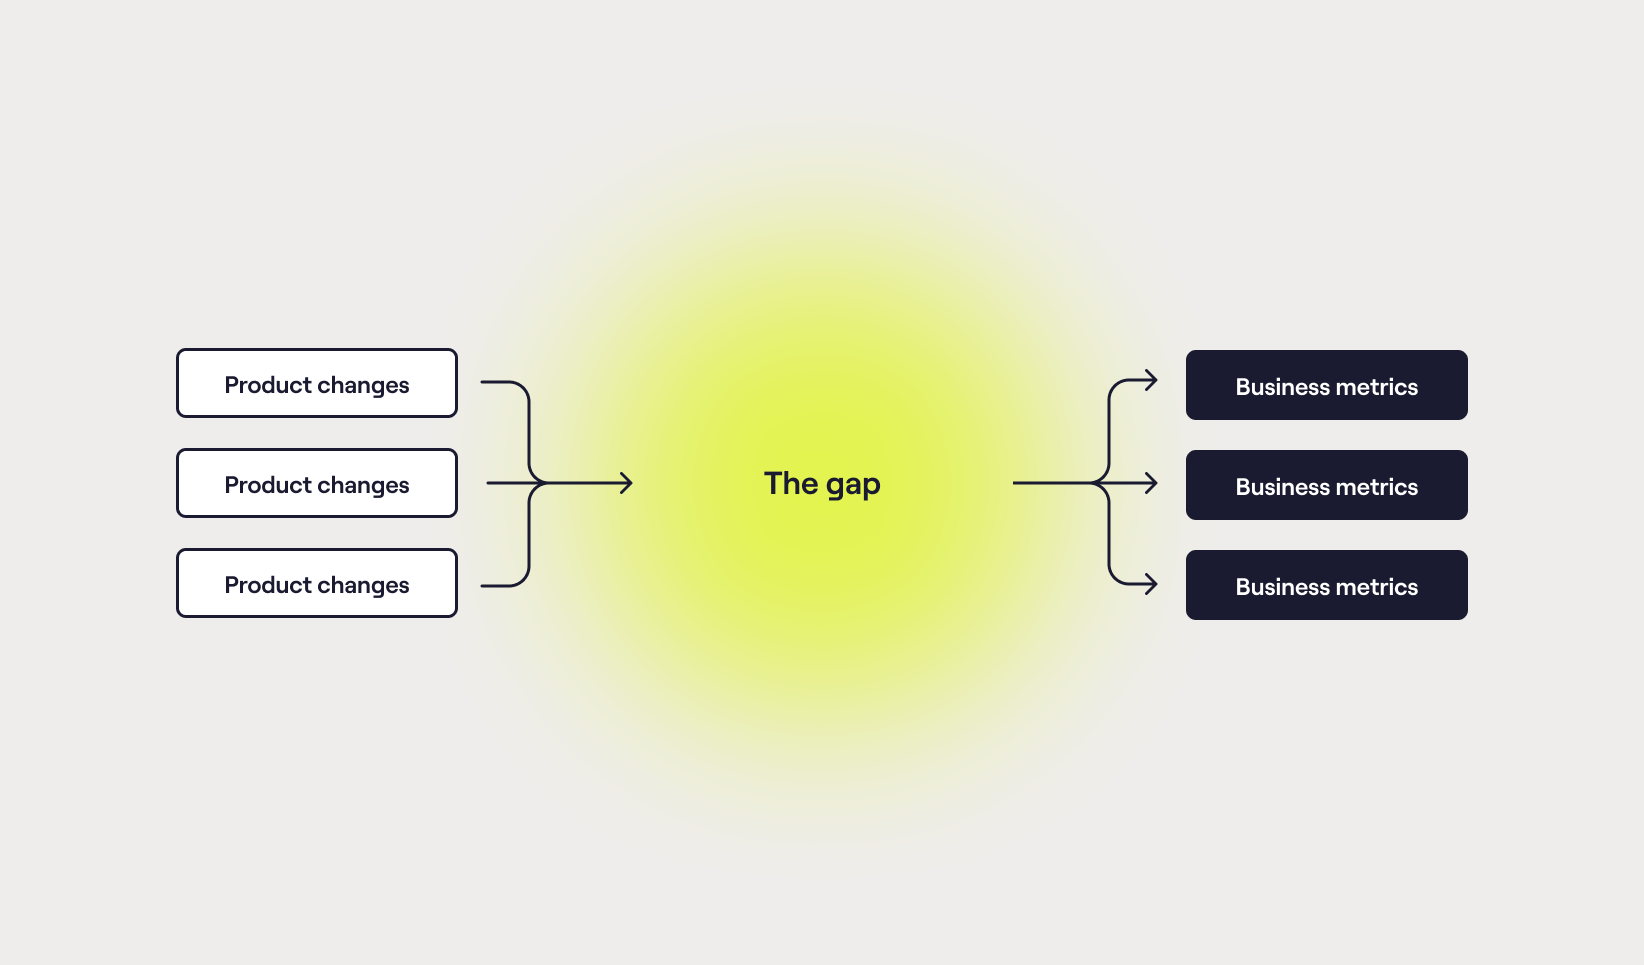
The result?
👉 Unclear definitions of success for product changes
👉 A disconnect between product decisions and business impact
👉 Opinion-led prioritisation
👉 A lack of focus
👉 Products that don’t quite reach their potential
👉 Discord
I’ve seen this play out across big orgs, scale-ups, and startups. And while everyone feels the pain, few have a structured way to fix it.
In this article, I’ll share a repeatable, step-by-step approach you can apply in your org - developed through work with teams at cinch, BBC, DfT, Dstny, thinkmoney, and most recently Capsule.
You’ll get:
- A breakdown of common root causes
- Practical tips to get alignment before you start
- A set of delivery models to fit your org’s maturity
- Templates and examples to help you move fast
- Lessons learned from the field
- Further reading to sharpen your product data game
Root causes
By no means exhaustive, but I’ve listed out the most common challenges I’ve seen in tech companies that aspire but struggle to be more data-led:
🔧 Instrumentation & tracking
Key events aren’t tracked at all.
Events are tracked inconsistently or inaccurately.
No clear taxonomy or naming convention for data.
Tracking is added too late in the development cycle.
📊 Data quality & access
Data is fragmented across tools (e.g. Mixpanel, Amplitude, GA, SQL, spreadsheets).
Nobody owns data cleanliness or consistency.
Teams don’t trust the data - it’s contradictory, or just “feels off”.
Metrics are lagging indicators that don’t inform day-to-day decisions.
🤯 Understanding & interpretation
No shared understanding of what good looks like (e.g. activation, retention).
Teams lack data literacy - they can’t confidently interpret charts.
Vanity metrics are prioritised over actionable ones.
No clarity on which metrics are leading vs lagging.
🧭 Decision-making & usage
Data isn’t used in prioritisation or product strategy.
Hypotheses aren’t tied to measurable outcomes.
There’s no habit of experimentation or learning from results.
Stakeholders cherry-pick data to support pre-decided views.
📉 Process & culture
Product reviews don’t include metrics or impact discussions.
Outcomes aren’t tied to objectives - everything’s a feature factory.
No rhythm for reviewing or learning from data.
There’s fear or shame around failure, so metrics are massaged or ignored.
🧑💻 Team setup & ownership
No clear owner for product analytics.
Data teams sit too far from product teams.
Engineers see analytics as a nice-to-have, not a core part of delivery.
Product managers (PMs) aren't trained or expected to own product data.
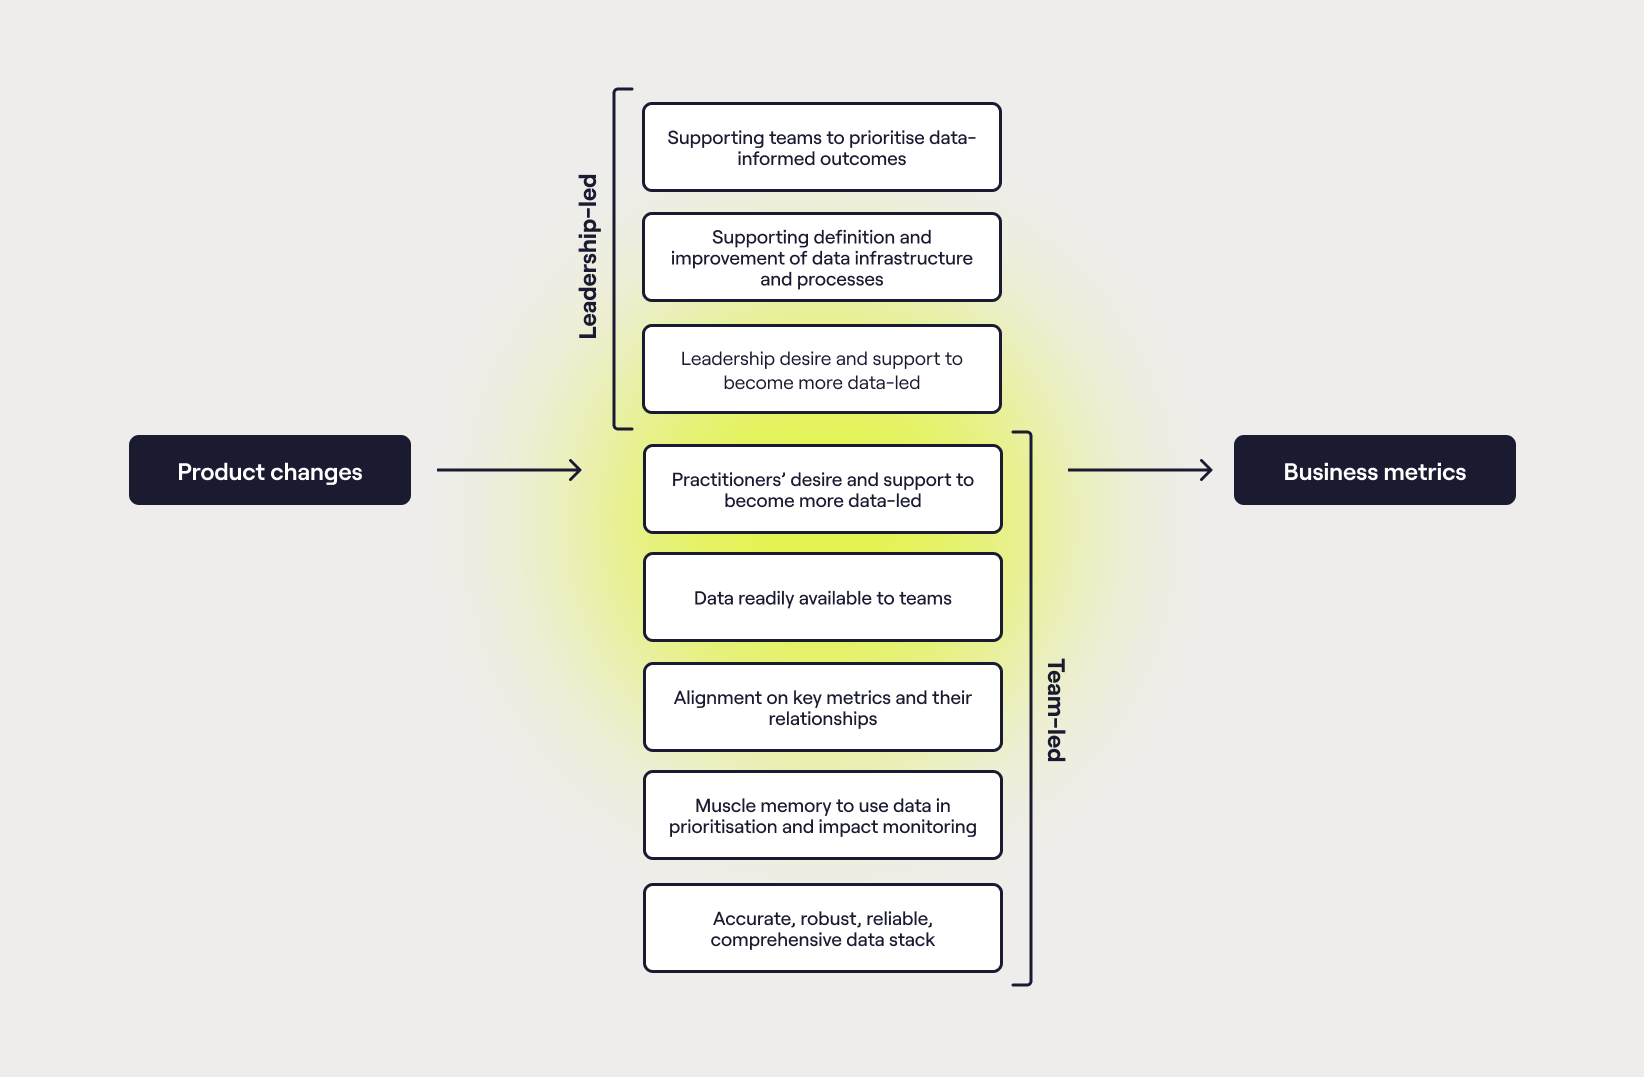
Considerations before you begin
To get the traction you need, there are three almost philosophical considerations that must be satisfied. Without these, there’s a very real chance that you won’t succeed:
- A genuine appetite from at least one product team to learn from, and make better decisions using product data.
- An appetite from leadership for product teams to learn from, and make better decisions that are guided by product data.
- An acceptance by all parties that this will take time and energy. It’s not something that can be squeezed in around the day-to-day. It takes focus, energy, and intention.
Beyond this, there are some practical considerations.
First, you’ll need to get the right people on the bus. The gold standard here is a working group composed of leaders and practitioners across all of the relevant disciplines. An example might be the CPTO, CFO, product manager, product designer, data analyst, and tech lead. The aim is to have a good enough spread to encourage diversity of thought, ensure both business KPIs and product metrics are well-represented, and build rapport and shared understanding.
Second, somebody in this group will need access to all necessary tooling - in all likelihood, to the data itself and the underlying infrastructure.
Third, somebody to lead this initiative. This could be anyone within the working group, but it’s strongly recommended that it’s somebody with product, data, and delivery management skills and experience.
Fourth, I encourage you to consider how you will deliver this. I’ve seen two different delivery models here:
Delivery model 1: Background
Staffing: Driven by product practitioners in their "downtime" alongside core product work
Timescale: 3-9 months, depending on factors above
Recommended when:
- Data maturity is higher
- Similar initiatives have built and maintained momentum in the past
- Low-to-medium pressure to tie product metrics to business KPIs
Tips:
- Establish working groups to help build and maintain momentum
Delivery model 2: Focused
Staffing: Appointing a dedicated, full-time product metrics lead to head up the accelerator
Timescale: 6-12 weeks, depending on factors above
Recommended when:
- Data maturity is very low
- Limited capacity / similar initiatives have struggled for momentum
- High pressure to tie product metrics to business KPIs
Tips:
- You could second somebody in the organisation to lead this for the 6-12 week period - a product ops specialist, principal PM, or data-leaning PM may be well placed.
- Failing this, one of Hyperact’s product consultants can lead these engagements on your behalf.
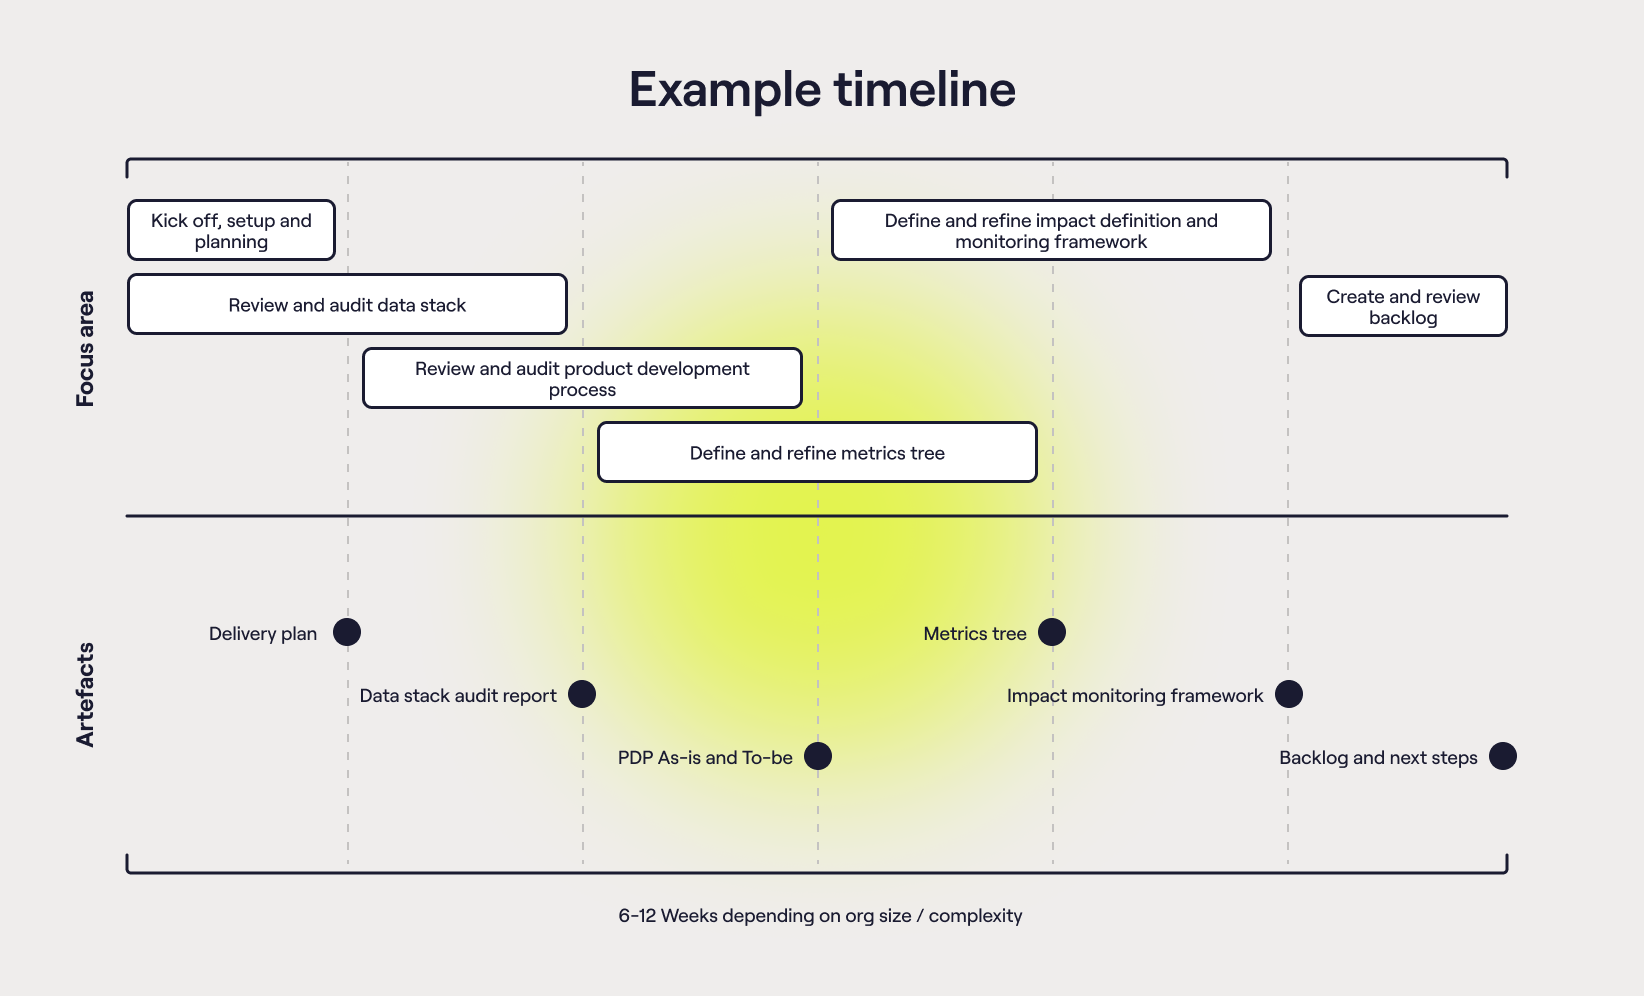
The approach
It boils down to the following activities, each of which helps build up one or more artefacts for the group (and wider audience) to rally around. The artefacts will ultimately become the single sources of truth for product metrics, but just as importantly, it’ll be the activities and conversations around their creation that will lay the foundations for shared understanding and alignment.
Kick-off session
A two-hour collaborative workshop for the whole working group on day one.
The aim is to align on objectives, agree ways of working, form relationships, and co-create a delivery plan. It’s where the tone and pace get set. This isn’t just box-ticking - it’s about building trust, securing buy-in, and getting everyone facing in the same direction.
Outputs: A fleshed-out delivery plan, clear responsibilities, and agreement on how and where progress will be tracked and shared.
User research
Think of this like product discovery - but your users are internal. Through a series of 1:1s and hands-on sessions with product managers, designers, engineers, analysts, and leaders, we explore how people currently work with product data: what tools they use, what questions they ask, how they define success, and where the pain points lie.
Outputs: Research write-ups that feed directly into the data stack and product development process models.
Data stack review
An audit of your current tooling and data infrastructure. This includes interviews, tooling deep-dives, and mapping out how data flows (or doesn’t) through your organisation.
We’re looking to understand maturity, trustworthiness, access, and usability - and to surface opportunities for simplification and improvement.
Outputs: A visualised data stack model, supporting documentation, and practical recommendations for improvement.
Product development process review
A close look at how product development happens today - not the official process, but how things actually get done. We step through 2–5 recent initiatives, dissecting how they were prioritised, delivered, and measured.
Check out our blueprint for modern product development as a starting point.
This gives a baseline for how well data is embedded today, and sets the stage for a future, more data-informed process.
Outputs: As-is and to-be process maps, and a shared understanding of the gaps.
Metrics tree workshops
This is the beating heart of the accelerator. We run three workshops:
A top-down session, surfacing key business metrics and strategic priorities.
A bottom-up session, mapping out leading and lagging product metrics based on user journeys and team insights.
A playback session, bringing it all together into a coherent draft tree.
The goal is alignment - not just on what to measure, but why, how, and where the data lives.
Outputs: A living metrics tree, complete with definitions and source links. Our Metrics Tree Miro template can help you get started.
Impact definition and monitoring workshops
Once the tree is in place, we use it to run dry runs of upcoming (or recent) initiatives - helping teams define hypotheses, identify success metrics, and outline how impact will be monitored post-launch.
This is where the rubber meets the road. It’s about turning theory into habit. About building and flexing new muscles.
Outputs: Completed impact definition boards and a reusable workshop format.
Product metrics backlog and roadmap review
By this point, you’ll have uncovered a stack of improvement opportunities - some big, some small. Rather than let them fade into the ether, we capture and prioritise them into a backlog.
It’s a pragmatic way to maintain momentum, focus on high-impact changes, and treat your product metrics work as a living, evolving platform.
Outputs: A prioritised backlog and next-step roadmap.
Lessons learned
Some hard-won lessons from running this playbook in the wild - the patterns that crop up again and again, and the nudges that can make or break momentum.
1. Lay strong foundations
Start with a straw man. Don’t begin with a blank page. Draft something early - whether it’s the PDP, metrics tree, or delivery plan - and let the team react.
Sequence matters. Think about the order of activities. Access to tooling is often a blocker - unblock that early so sessions don’t stall.
Get key people in the room. Especially for the kick-off. You want the right voices (and the decision-makers) involved from day one.
Over-communicate. Use async updates and artefact sharing to keep momentum and reduce reliance on meetings.
Set expectations. This isn’t a silver bullet. The accelerator gives you a platform - but building muscle memory takes reps, not rituals.
2. When in doubt, dig deeper
Talk to everyone. Data leads, analysts, engineers, product managers, marketing - you need a 360° view of how data is (and isn’t) used.
Get your hands dirty. Reviewing the data stack or PDP isn’t a passive exercise. Log in. Click around. Model things. Draw it up.
Play it back. Don’t assume shared understanding - show your work, walk people through it, and invite challenges.
Challenge the status quo. Whether it’s existing processes or tool choices, be willing to ask why things work the way they do - and whether they need to.
3. Keep your models simple - and evolving
Top-down beats bottom-up. Start with business goals and work down from there. It’s often faster to align and easier to make trade-offs.
Don’t include everything. If you’re unsure about a metric, leave it out. Smaller, clearer trees get more use.
All models are wrong. But some are useful. Don’t chase the perfect system - iterate in the open.
Define everything. Consistency matters more than cleverness. Build a dictionary and stick to it.
Default to pirate metrics, which provide a solid base for most product journeys - especially in B2C or PLG contexts.
Focus on value. Where possible, measure both end-user value and business value. If you have to pick, prioritise the end-user.
Test your assumptions. Correlation isn’t causation - but experimentation builds confidence.
4. Build habits, not just artefacts
Include the basics. In impact sessions, don’t assume everyone knows what the change is. Set context before diving into metrics.
Avoid duplication. If you already run discovery sessions or initiative reviews, see if the impact workshop can plug in.
Stress-test the templates. Run dry runs. Refine as you go. What works for one team won’t always land with another.
Keep measuring. Even if data isn’t driving priorities yet - always define and monitor impact. It helps build the habit.
Act like a platform team. You’re not just building dashboards - you’re enabling teams to do better work. Unblock them. Enable them.
5. Don’t try to do it all
You can always go further. But that doesn’t mean you should. Focus on the few improvements that unlock the most value.
Avoid ‘everything everywhere all at once’. You don’t need perfect coverage - just enough momentum to keep moving.
Beware diminishing returns. At a certain point, more metrics and more tooling just create noise.
Don’t get blinded by data. This work is about clarity, not complexity. The goal isn’t more data - it’s better decisions. And be sure to remember that product usage data is just one source of insight - you’ll still need to couple this with a strong product strategy and continuous discovery to create and grow awesome products.
Further reading
A curated list of resources to help you go deeper — whether you’re getting started, making sense of frameworks, or looking for hands-on tools.
📘 Foundational reading
Evidence-Guided (Itamar Gilad) – A practical guide to making better product decisions by combining data, customer insights, and team judgement. Brilliant for shifting culture toward evidence over instinct.
Measure What Matters (John Doerr) – The essential guide to OKRs, packed with real-world stories. Helps connect metrics to company-wide objectives and maintain alignment at scale.
Lean Analytics (Alistair Croll & Benjamin Yoskovitz) – Helps you zero in on the one metric that matters most, depending on your stage. A great foundation for early-stage teams or anyone feeling lost in the numbers.
🧠 Conceptual frameworks and their application
KPI Trees (Petra Wille) – A structured way to connect customer behaviour to business outcomes. Ideal when building your first metrics tree or making it easier for teams to see the bigger picture.
North Star Playbook (Amplitude) – A comprehensive guide to finding and operationalising your North Star metric. Especially useful for aligning teams in product-led organisations.
AARRR vs North Star vs HEART (Hyperact) – Compares three well-known metrics frameworks — their strengths, weaknesses, and where they fit. Great for finding the right approach for your team.
Getting the Most Out of Pirate Metrics (Hyperact) – A practical guide to applying the AARRR framework sensibly in the wild. Especially relevant for B2C or PLG products.
How to Do a Linear Regression and Correlation Analysis (Olga Berezovsky) – A beginner-friendly intro to correlation analysis — good for testing assumptions in your metrics tree or identifying leading indicators.
Product-Led Growth Keynote (Leah Tharin, MTPCon 2025) – A sharp, strategic keynote on how product-led organisations think about metrics and value delivery. Good ammo for exec conversations.
🔧 Ways of working
Lean Comms (Hyperact) – Tactical advice on how to collaborate with less noise. Helpful when setting up working groups or operating across time zones.
Data for Product Managers (GitLab) – A behind-the-scenes look at how GitLab supports PMs to self-serve and make better use of data. Strong inspiration for internal enablement.
Unlocking Your Product Data (Hyperact) – Lays out the common blockers to using product data effectively — and how to tackle them. Ideal for teams overwhelmed by tools but starved for insight.
Blueprint for Modern Product Development (Hyperact) – Defines what a healthy, outcome-focused product development process looks like — with data baked in from start to finish.
Activation Metrics for Product Engineers (PostHog) – A practical guide for engineers and PMs on what activation actually means, how to define it, and how to measure it properly. Great for cross-functional collaboration.
📐 Templates
Service Blueprint Template (Miroverse) – A versatile template for mapping user journeys, backstage processes, and data interactions. Great for spotting metric gaps and aligning teams.
C4 Architecture (Miroverse) – Helps you visualise how your systems and data infrastructure fit together. A handy tool for data stack reviews or onboarding new team members.
Metrics Tree Template (Miroverse) - A clear, structured way to break down high-level business goals into measurable metrics. Useful for aligning teams on what matters and designing instrumentation that supports decision-making.
In summary
There is no single blueprint for getting this right. Every organisation is different - your structure, culture, tools, and maturity all play a part. But this approach gives you a strong, sensible default: A way to align teams, connect product changes to business impact, and build muscle memory around using data to drive decisions.
We’ve refined it across multiple organisations - large and small, public and private sector - and tailored it to suit different levels of maturity and urgency. If you're looking to make your product metrics work harder for you, we’d love to help. Get in touch if you'd like to talk through what this could look like in your context.