The big five product metrics and their many anti-patterns
Bad metrics cause more damage than no metrics. Targeting too high, focusing too low, or jumping straight into the messy middle - I've seen each of these derail otherwise strong teams.
Earlier in my career I made these mistakes myself. I tracked things that were easy to measure rather than things that mattered. I targeted metrics that moved for a dozen reasons that had nothing to do with my team's work.
The problem is rarely a lack of data. It's a lack of structure to make sense of it. No clear picture of how day-to-day metrics connect to what the business actually cares about. These five tiers emerged from years of building data maturity in product teams and modelling how metrics connect. This is the pattern I keep coming back to.
Here's what they are, when to use them, and the anti-patterns worth watching out for.
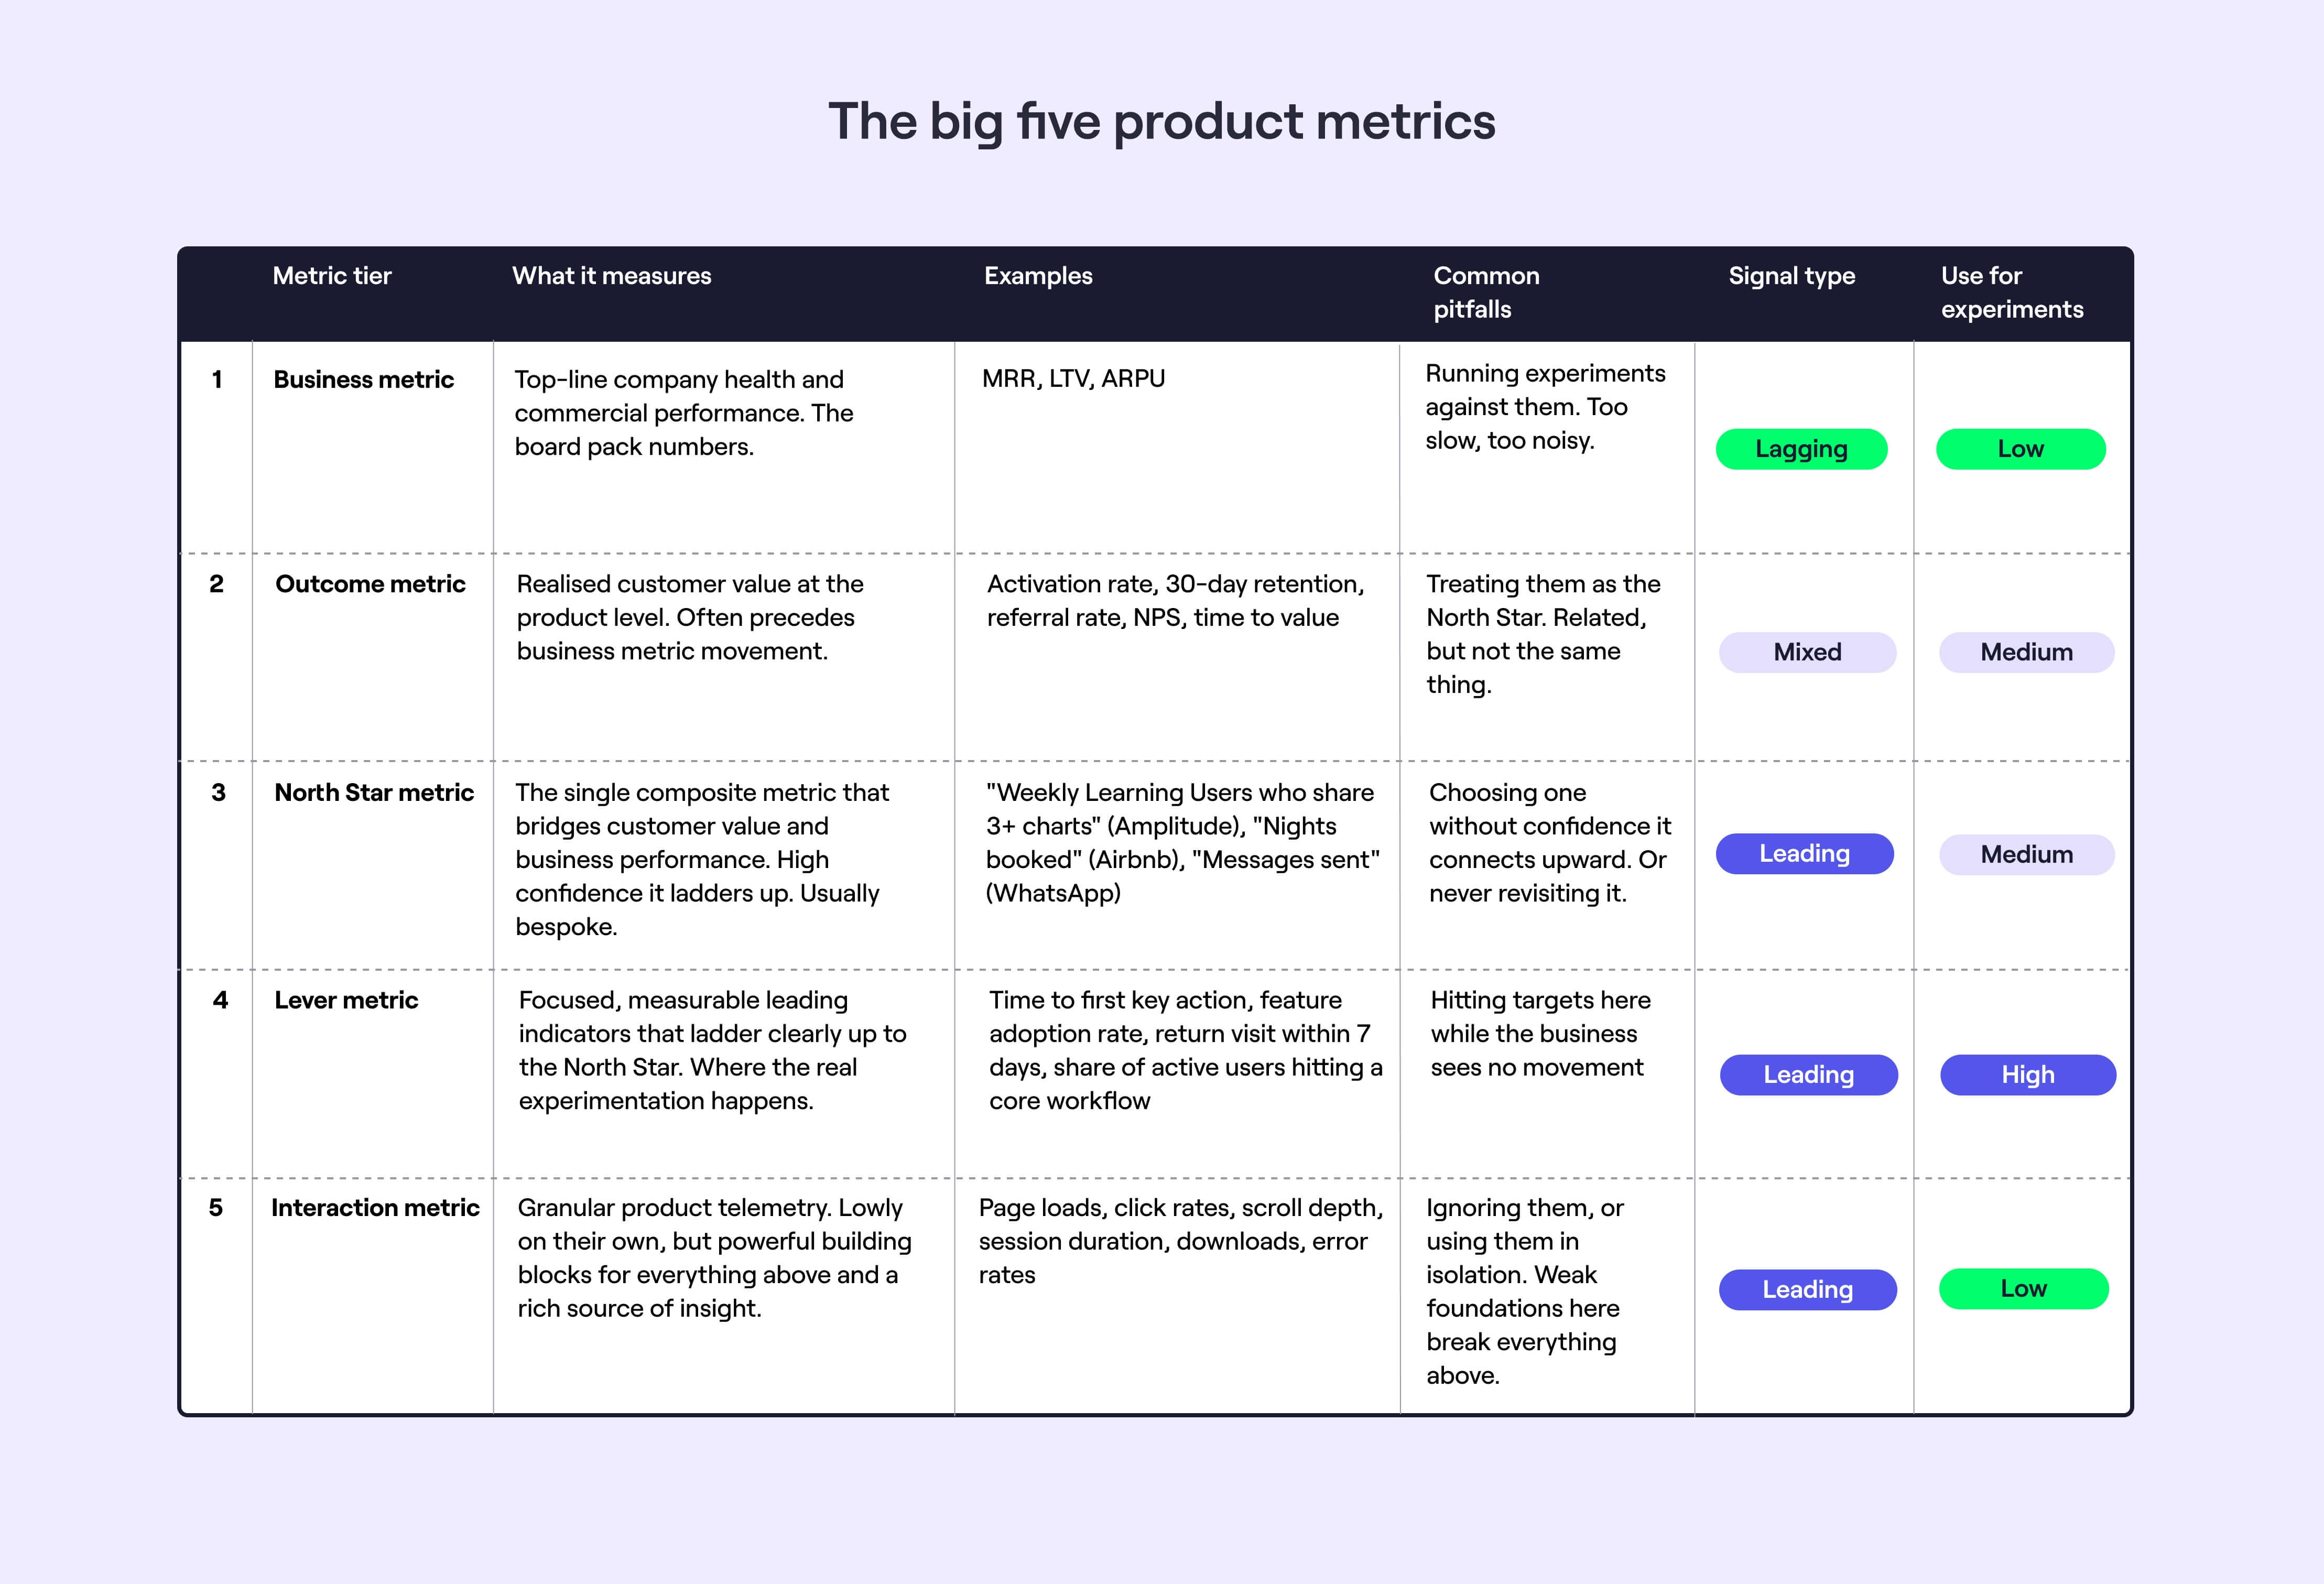
Business metrics
The big ticket metrics you’d expect to see in a board pack or a press release. Think MRR, LTV, ARPU.
Outcome metrics
These reflect realised customer value at the product level, and often precede changes in business performance. A lot of classic SaaS metrics can sit here - think the non-revenue pirate metrics of acquisition, activation, retention, and referral.
North Star metrics
Where a lot of modelling and brain power is spent, and able to make or break strategic alignment. Often an aggregate of several metrics. Usually leading rather than lagging, but not always. High confidence that these ladder up to outcome and business metrics. “Weekly Learning Users (WLUs) that consume and share more than three charts” is a classic Amplitude example.
North Star metrics often overlap with outcome metrics in practice - the difference is that they're usually composite, bespoke to your product, and built specifically to bridge customer value and business performance.
Lever metrics
The focused, measurable leading indicators that ladder up to the North Star. High signal potential for experiments, and just specific enough to rally a team around to cook up ideas and experiments to move the needle.
Interaction metrics
Don't underestimate these. Product telemetry contains more signal than most teams realise. They serve as building blocks for grander concepts. Page loads. Click rates. Downloads.
So what?
When I join a new team, I start with four principles. Not all teams have the luxury of doing this properly from day one - you might be heads-down delivering from the moment you land, in 0-1 mode where the data doesn't exist yet, or you might inherit a data vacuum. But even a rough version of this is better than none.
1. Map all five levels. You don't need perfect definitions to begin, but you need a rough sense of where your interaction metrics sit, what your North Star is, and how they connect to business performance.
2. Align on a North Star. You probably won't get full consensus - that's normal. What matters is starting with something defensible and being willing to revisit it as you learn.
3. Work with your team to identify a lever metric. Specific enough to generate ideas and run experiments, connected clearly enough to the North Star that progress means something.
4. Build and iterate a model connecting the five tiers. It'll be wrong at first. That's fine - what matters is that it exists and that you keep refining it.
Anti-patterns
The same themes emerge again and again. I've found myself wrapped up in most of these at one point or another. Some are technical problems you can fix with better infrastructure. Others are cultural - they need leadership buy-in and patience to resolve. A few are just the reality of working with imperfect models and incomplete data.
Measure impact too high
Experiments and strategies target metrics too high up the hierarchy. Signal takes months to emerge. Business metrics move for a dozen reasons, and you can't tell if your change had any impact at all.
Set strategy too low
Teams focus on lever metrics, or even interaction metrics, without any confidence that they ladder up to broader product and business goals. Targets get hit, the business sees no movement. Everyone's busy shipping, nothing's changing at the top.
Start in the messy middle
Product managers throw themselves into lever metrics territory without taking the time to understand how they may ladder up to outcome and business metrics, and ladder down to interaction metrics.
Ignore the power of interaction metrics
So much insight can be found in looking at product telemetry. And without robust foundations at this layer (both infrastructure and understanding) it’s much harder to get it right as you go up the ladder.
Every metric all at once
By trying to nail all levels or simply targeting too many, teams end up tying themselves in knots when looking to prioritise changes, or assess impact.
Following the data religiously
Ignore user research at your peril. Qualitative research often gives a strong enough signal, and is usually easier to interpret.
And instinct matters too - be that your own, or that strong-headed founder/CEO.
Chasing certainty you'll never get
Tying product improvements directly to business metrics is a worthy ambition - and something most teams don't attempt nearly enough. But it requires modelling, and models are flawed. Define the model, use it, and iterate. A strong product-finance relationship helps here, as does having real data expertise to build and surface the models.
Metric displacement
Move one metric and another shifts in the wrong direction - often one higher up the chain. A product leader I worked under called this squeezing the cushion: fix one corner and it bulges out elsewhere. Call it out before you run your experiment. A dry run helps surface it early.
Shaky foundations
Without solid data engineering and analytics infrastructure and tooling, it can be incredibly difficult and often misguided to be truly data-informed. Likewise if you don’t have real support from leadership, and you don’t have the expertise across product, engineering, and data.
Empires and bottlenecks
Data functions are centralised more often than not in my experiences, with mixed results.
When this doesn’t work, it's usually down to that central data function becoming a constraint, and it being too difficult for product teams to get the data they need.
When it works well, it's often due to a top-down culture of openness, having product thinkers within the data function, and decentralising to a lesser or greater degree by pushing out some elements of data engineering or analysis to the product teams themselves.
Multiple sources of truth
There is always some of this, and it takes continuous course-correction to keep this in check.
If you completely lock this down by limiting tooling to an elite few, whilst you’ll have tighter definitions of metrics, you’ll likely stifle the innovation of your teams. If you go too far the other way, you can end up with eight different definitions of activation. The sweet spot is somewhere in the middle, and a few tactics that can help here include a glossary, a set of template reports, regular show and tells referencing core metrics, and regular review and consolidation of data dashboards and docs.
Underestimating the work involved
Using data effectively does not happen by accident. It’s very hard to do this as a side-of-desk activity. Check out our step-by-step guide for a feel of how involved it can be to do this well. And if nothing else, acknowledge that this will take time and energy away from your practitioners and leaders if you want to nail this.
In summary
Metrics done well unlock better decisions and clearer priorities. Metrics done badly create confusion and misalignment.
It can be more straightforward and accessible than you might think - five tiers from business metrics down to interaction metrics, connected by a model that you iterate over time. But getting there requires investment in infrastructure, expertise, and culture.
You'll make mistakes. Your model will be wrong. Different teams will measure things differently. That's fine - the goal isn't perfection, it's progress.
Start somewhere. Build your model. Test it against reality. Fix what breaks. And keep your team aligned on which metrics matter and why.
The alternative is worse - drowning in data whilst lacking insight, or making decisions based on gut feel alone.